![]()
![]()
![]() Visual Analyser Project (
current v. 26 Silvia edition )
Visual Analyser Project (
current v. 26 Silvia edition )

|
|
|
|
What's new25 Silvia edition version News - Graphics equalizer - Read/play file wave, flac, mp3 - Extended 3d surface - Menu - Check new version and automatic download - Frequency response tool - ...and much more! (TBD complete list)
2014 version News (TBD) 64 bit supported plus a lot of bug fix
2011 version As usual a lot of important new features ...and more. For example, as you can see from the picture below, the waterfall (3D checkbox on main panel) has been added.
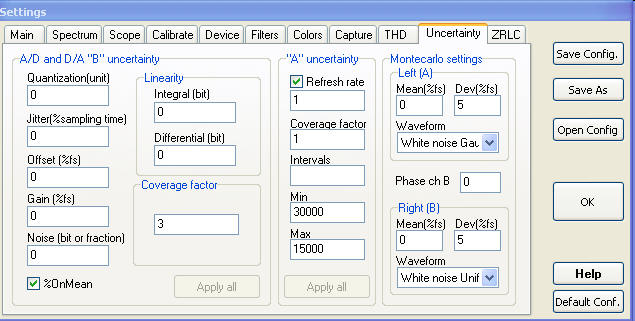
Then, a very strong new feature is the possibility to evaluate the measurements uncertainty (as far as I know not still present in other programs of this category). This is a huge field, and I'm simply trying to explore it moving the first steps. For example, below you can see the "settings" window with the option allowing to set the values of the most significant error cause of "B" type, that is the Quantization Error, Jitter, Offset, Gain, Noise and linearity due to the acquisition board (for example the sound card). Also, the set up option for another kind of uncertainty, that is the "A" uncertainty, known as "statistic uncertainty".
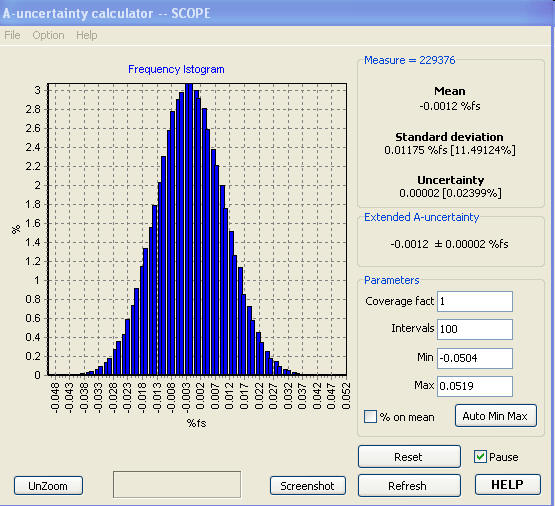
By the way, for each implemented instrument there is the possibility to invoke a "statistical window" (see figure below) which allows to compute in real time the frequency Histogram (in the screenshot below reported erroneously as "Istogram"), mean, standard deviation and extended uncertainty.
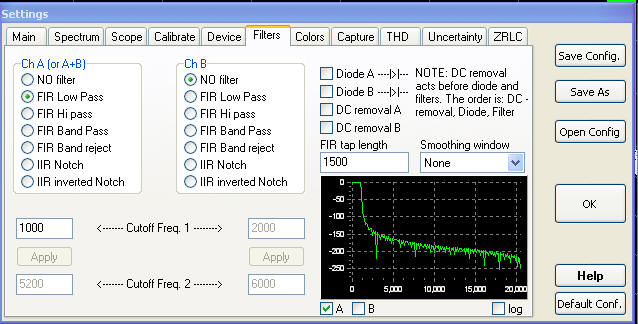
Another important feature is the Monte Carlo virtual input device. That is, the user can select as input device (in setting windows) the "Monte Carlo" device (you should select the checkbox "Monte Carlo" in settings window, under the tab "device"). Then, after you have turned on Visual Analyser, the input waveform selected from the "montecarlo settings" menu of the figure above (of the settings window) will be internally generated. The parameter you set for the error (quantization, noise, gain etc.) will be applied to the waveform synthetized allowing to evaluate, by means of the "statistical window", the uncertainty of measurements (Monte Carlo analysis). Each measurement instrument can compute the overall uncertainty (statistical plus "B" uncertainty) in real time. That is the frequency meter, the voltmeter, and the ZRLC. The spectrum analyzer and oscilloscope at the moment can compute only the statistical uncertainty. In each instrument there is a checkbox for the real time calculus of overall (extended) uncertainty, composed from the A + B uncertainty, and a checkbox to invoke the statistical window (they can be checked both) The remaining (and not less important) new functions introduced in 2011 version are: + preview window in filter setting and possibility to define the number of "tap" of FIR filter
+ NO flickering on all the graphic window (spectrum analyzer, oscilloscope etc) by means of double buffering; + New frequency meter option, allowing to set a threshold for the calculus of the peak harmonic. In this way only the harmonic that exceeds a predefined threshold respect the overall amplitude in % full scale; + Enhanced 24 bit setting; + New screen shot windows to capture scope and spectrum graphic, with possibility to save to file and clipboard; + Spectrum with "full", "Single" and "min max" option. Full means plot each harmonic; "Single" means to plot only the harmonic of maximum amplitude for each pixel; "min max" means to plot only the harmonic with the minimum and maximum value for each pixel; this latter produce a graphic identical to the "Full" modalities, but saving computational resource. On the other hand, also the "Single" option allows to save resource (more than "min max") but painting only the higher value of harmonic; + In scope windows possibility to select "full" and "min max" option; + A lot of minor bugs fixed;
2010 NE-XT v2.4 version This is an upgrade full of many details and also a very important news. First of all, a further method of signal generation added for ZRLC. In Setting window, and ZRLC tab you can find another option along with the checkbox related to "autobias". The new option "LoopGen" is checked by default, to assure compatibility with users of 2010 NE-XT version. If you de-select it the generation method of sine wave change from "loop" to "real time" generation. This allows to use also pairs "frequency sampling / point of buffers" with a decimal ratio assuring sine wave without distortion also in this case. The possibility to use the pair 44100 and 4096 points is of particular interest in case of use of Nuova Elettronica new hardware (in a couple of days should be available the whole article in pdf, although only in Italian language. The number of pairs with eXTtended calibration method has been enlarged, and to signal it the write "freq" in ZRLC window became GREEN if eXTended, black if standard calibration method. A new method of auto-output level determination has been implemented, avoiding unwanted oscillation is some occasion. The capture window of ZRLC has been strongly improved, and the viewer of captured .tee file is now capable to recognize automatically the kind of .tee file (i.e. if captured with "capture scope", "capture spectrum" or ZRLC and THD; moreover is now possible to write text data directly in clipboard, allowing for example to paste directly in other applications as MS EXCEL.
2010 NE-XT version Great news in this version. A lot of work behind. First of all naturally the ZRLC meter; the Italian magazine Nuova Elettronica is working upon a specific external hardware for ZRLC meter, and the ROGA-instruments adopted VA as basic freeware program for its measurement boards (for example ROGADAQ2). The main new features added during the last winter (that I actually remember!): + ZRLC meter, allows to measure impedance and also input impedance of amplifier, transformers, loudspeakers; possibility to execute measurements at different frequencies and with automatic sweep in time and frequency domain; + Calibration strongly improved, added dB, DC, Peak, and a different algorithm to calibrate from RMS value; + Voltmeter with DC (if acquisition board DC-coupled) and resolution calculus (depending of calibration values); + Off-line viewers for file saved in Capture scope, Spectrum Thd and ZRLC capture; file saved in .TEE format now works; + Compensation function fixed, added standard A,B,C weighting function acting in contemporary with custom compensation; + Input/Output Gain button added, launching Windows mixer if XP, audio setting utlity if Vista/Seven; + 24 bit soundcard recognition improved; if the soundcard/acquisition board is not a true 24 bit, VA works anyway using 24 bit word while encapsulating standard 16/8 bit data; + Capture windows improved; fixed the save function in .tee/.txt format; + In function generator added smooth transition and DC generation (for DC-coupled board); + "Values" window, with real time calculus of Peak, Peak-to-peak, Mean, Crest factor, Frequency (by means of a simple zero-crossing algorithm) True RMS, Form factor; + Phase window improved fixing some minor bugs; real time difference phase calculus added with possibility to select a specific frequency; + Sweep function improved and fixed, added bi-directional sweep; + A lot of minor bugs fixed.
2009 HR version After a very long long time the "2009" version of Visual Analyser is ready. A lot of problems arose when I tried to compile Visual Analyser using new version of the compiler (BC++2009 at the moment) and trying to write a version fully compatible with Windows Vista. Now the current release seems to be stable and bug-free and Vista compatible (also Windows 7) . VA2009 at the moment is no longer compatible with Windows 9x. HR stands for "High Resolution"; to reduce dramatically the influence of the "rounding error" IEEE 80 bit floating points variables has been used. + 80 bit IEEE floating point has been used for lower rounding error and better accuracy + RMS value in voltmeter fixed + Cross correlation (see channel selection listbox in main window) + Cepstrum analysis + THD measurements with "auto" function, display of THD curves, calibration + Improved screenshot capture + Improved capture function (in each capture window you can save and read graph in txt and tee format + Added "output" volume control (in main window and THD tabsheet) (=wave out in windows mixer) + Added "output" volume control in wave-gen/General_setup (= master of windows mixer volume control) + In Settings/Device added buttons with direct link to mixer windows for the selected soundcard, both for input and output mixer (XP) + New graphic engine + Runtime themes + Check of saved settings fixed + A lot of minor bugs fixed
10.0.5 NE version + Added calibration in dB + A bug in rms and pp calculation + A bug in Visual Tool Phase + In custom function "manual" now you can add more harmonics (99) + Added the possibility to change the frequency also with a custom waveform: for now is a "beta" feature + Minor bugs
10.0 version I decided to increment by one the number of release, instead to change the name in "VA 2007", for a lot of reasons. Below all the "news" related to this new and strongly improved version.
+ The phase window has been completely fixed, now is more stable and reliable; + A - B and B - A option added; more correctly I changed the old A - B and B - A in "Transfer function" i.e. A/B and B/A. Actually it was correct also in the previous version. I fact, I intended A - B and B - A in the logarithmic spectrum, that is the difference in logarithms is the ratio in "standard" world. + Linear Spectrum completely updated, is now possible display the scale in VOLT and %full-scale and you can "move" the spectrum scale with mouse as for dB scale; + In function generator added "square aliased", a fast version of square wave but with aliasing; + The "capture spectrum" window now as the possibility to display the phase, and save/open both the spectrum and the phase; added also the possibility to capture linear spectrum; + Added screenshot capture in .bmp format; + In Voltmeter function added the "true rms" value and mean value. The voltmeter has been improved with a new interface; + Improved autoscale in linear and dB spectrum; + "same as" button in general setup of Function generator; + Visual Tool of Function Generator now more powerful and fixed; % fullscale added; + % full scale and dB also in standard function generator; + A lot of minor bugs fixed.
9.0.6 version Waiting for the 2007 version, some bug has been fixed and other changes has been done. +Log scale in phase window as for the spectrum analyzer; +A bug in the scope scale; sometime it was divided by 2; +The calibration "tab" (Settings window) has been improved with more check +The frequency compensation function has been fixed and a "clear button" added for each channel +The 9.0.6 version has been compiled with the new RAD Studio 2007 In the near future an important Electronic magazine (www.nuovaelettronica.it) is going to publish an important project about Visual Analyser...
9.0.1 version I'm awfully sorry for the (little and stupid) bugs present in the 9.0 version. Now should be all fixed, in particular: +The log scale in function generator has been fixed, it disappeared in some conditions +Changing the range the cursor of the trackbar of the function generator was not updated properly +At first installation a wrong "bit per samples" in function generator caused the "wrong parameter" error; anyway it disappeared as soon as the general setup was used +The setup program of 9.0 version did not set the start directory at the installation value (for instance "c:\programs\sillanumsoft") so the "check.exe" utilities could not be found when the user press the "check new version" button. On the other hand it is always possible to set it manually in the 9.0 version, if you don't want to download the 9.0.1. You can also use the "check" program as a standalone program, for example to download the 9.0.1 version.
9.0 version +VA has been compiled with the latest version of Borland Developer Studio +As consequence of the previous point, the 24 bit soundcard are correctly detected +The main window has a new tab for more "fast" option +The "ON" button include also the off button +Minor bugs on calibrate function and Compensation function +Auto update window added; you can check online if a new version of VA is ready to download. If yes, you can download it and install automatically. +Added correct detection of Windows version, VISTA included +Log scale has been strongly improved (possibility to start from 1 Hz) +Possibility to trig left channel with right channel (thanks to Dave) +Log scale for function generator (thanks to Dave) -Minor bugs with VISTA: with some kind of soundcard problems in function generator -As soon as possible: log scale in sweep; "smooth transition" between two adjacent frequencies in function generator. -some minor bugs in the latest added feature
8.30.19 version +a lot of minor bugs fixed +more option on main window ()
8.30.11 version A little last-minute bug was found in compensation window.....sorry...just fixed.
8.30.10 version: +added COMPENSATION window; you can add a frequency compensation (checkbox "comp", or setting window/spectrum/compensation button). A powerful window for defining new custom frequency compensation curves has been added. For example you may want to compensate the microphone frequency response. In the directory "c:\...\sillanum soft\frequency compensation" has been added some microphone compensation files. +possibility to define a custom X-axis scale for spectrum analyser. Go to setting window and then spectrum tab; you'll find a "freq. Range" groupbox with the possibility to define a custom x-axis frequency range +a new visual tool for custom function defining window (1.0). Do not forget to disable the "loop mode" in main tab of the wave window; otherwise you'll not be able to push the visual tool button +a lot of minor bugs has been fixed +I've been looking for fix the 24 bit soundcard problem, fixing some little bug. Indeed, Visual Analyser should be able to detect correctly the 24 bit soundcard from the firsts version. I used the Windows API to do that, but unfortunately with the USB souncard and with some kind of PCI soundcard seem to arise problems. I think I should use the ASIO drivers, but for now I've no time to add. If someone has some suggestion about the standard API, thank you! +a renewed info window
8.10 version: +capture scope window : completely new, with possibility of spectrum computation. Remember, you can scroll graphs with right mouse button, zoom by dragging left mouse button and undo zoom dragging a reverse square. +in capture window you can define a pre-acquisition level: go to setting/"capture scope" and select the number of pre-acquisition buffer (up to 5 buffers)
+capture spectrum window completely new +minor bugs
Press ReleasesThese are the press releases we've issued over the last year. You may want to search for topics by keyword.

|
Latest VA reviews, articles:
|
|
Send an e-mail to
alfredo[at]accattatis.org for questions and/or suggestions about the web
site. The webmaster is Alfredo Accattatis. |


![[New!]](images/smallnew.gif)