Custom Spectrum is an alternative spectral-analysis mode based on a bank of Goertzel filters. Unlike a conventional FFT, it is not tied to a uniformly spaced frequency grid: the frequencies to be evaluated can be chosen freely, including non-integer values.
Why Goertzel?
A Goertzel filter behaves like a second-order resonator centred on one selected frequency. A bank of these filters evaluates only the components of interest. The computational cost grows with the number of selected frequencies, so VA limits the Custom Spectrum to a practical number of components, but gains complete freedom in their placement.
Arbitrary frequency plans
The user can create a spectrum containing selected tones, fractional frequencies, harmonics of a known fundamental or bands designed around a specific test. This is useful when a conventional FFT grid would provide many unwanted bins while not placing the measurement exactly where required.
Standard, 3D and Waterfall views
Custom Spectrum
A set of freely selected frequency components, normally shown as bars or a connected profile. The frequency axis is defined by the chosen Goertzel filters.
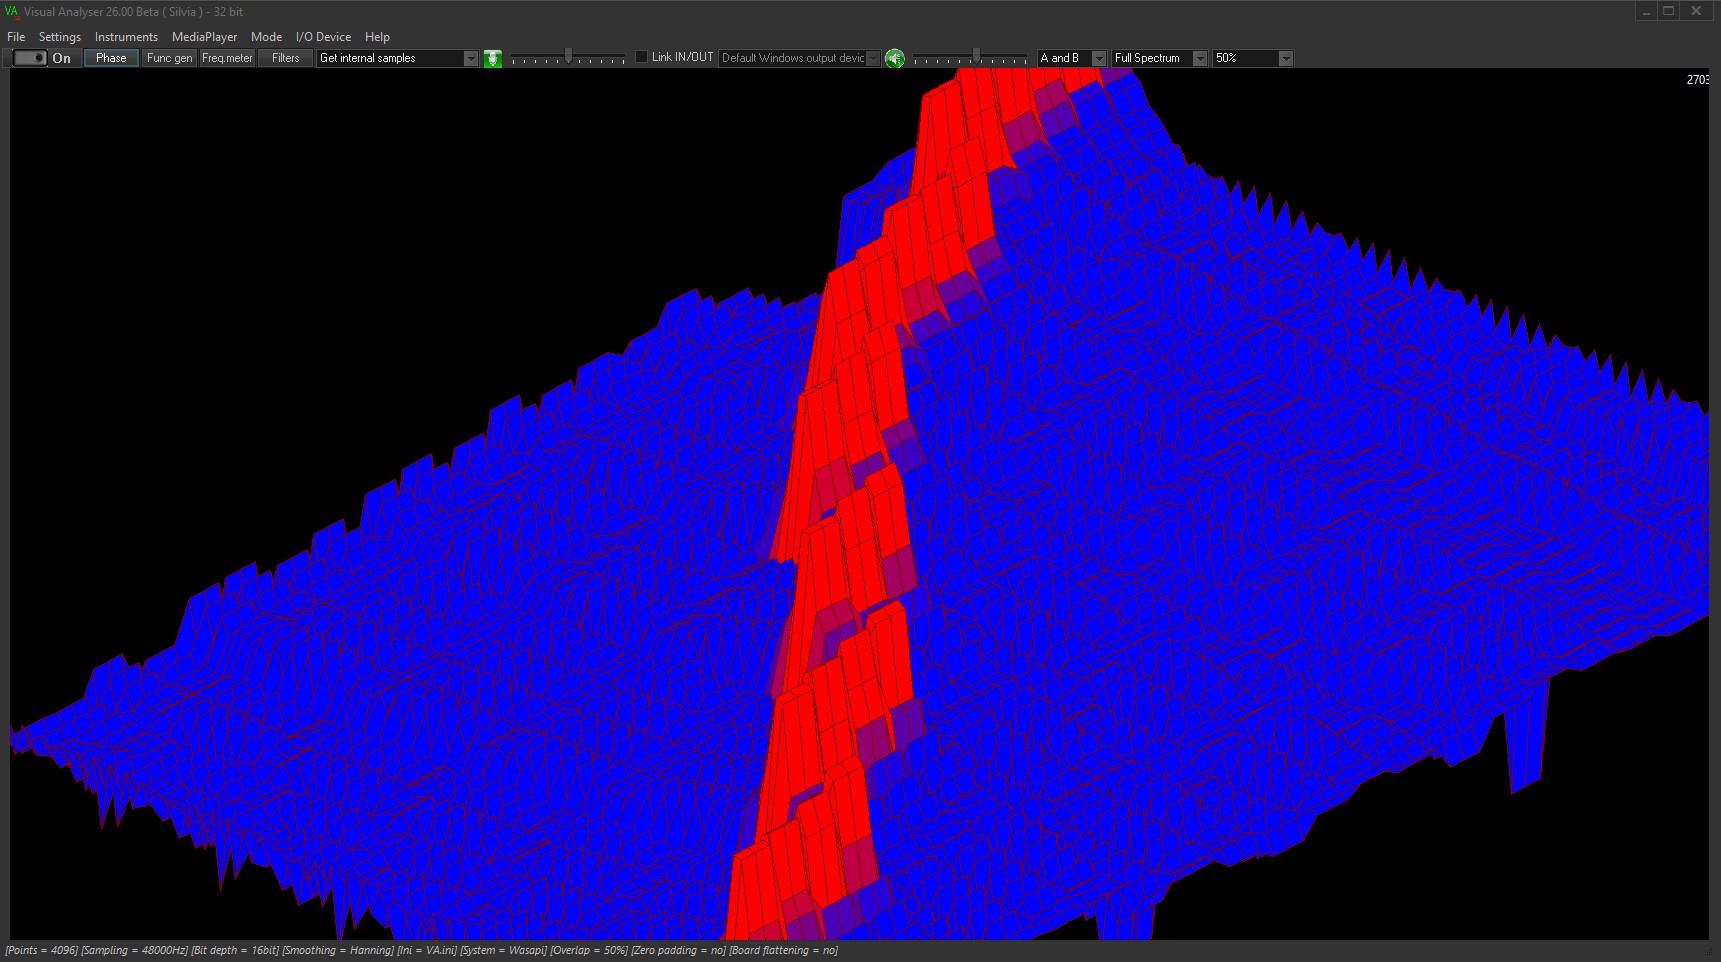
3D Spectrum
A real-time coloured surface built from successive Custom Spectrum results. It emphasizes the evolution of selected components with time.
Waterfall
A time history of consecutive spectra. It is conceptually a sequence of spectral slices and is useful for observing decay, transients and slowly changing signals.
Conventional FFT
A complete uniformly spaced spectrum calculated from one acquisition buffer, with frequency resolution determined by sample rate and buffer size.
Typical uses
- Monitoring selected harmonics
- Measurements on arbitrary frequency grids
- Tracking known interference components
- Compact real-time 3D representations
- Application-specific spectral panels
- Frequency values with decimal precision