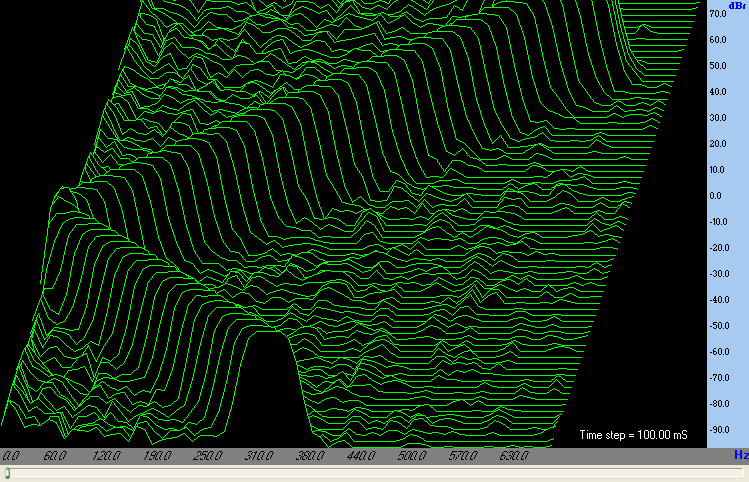
The spectrum analyser is one of VA’s core instruments. It reveals the fundamental, harmonics, noise, intermodulation products and system response, and now offers two complementary engines: conventional FFT analysis and the arbitrary-frequency Custom Spectrum.
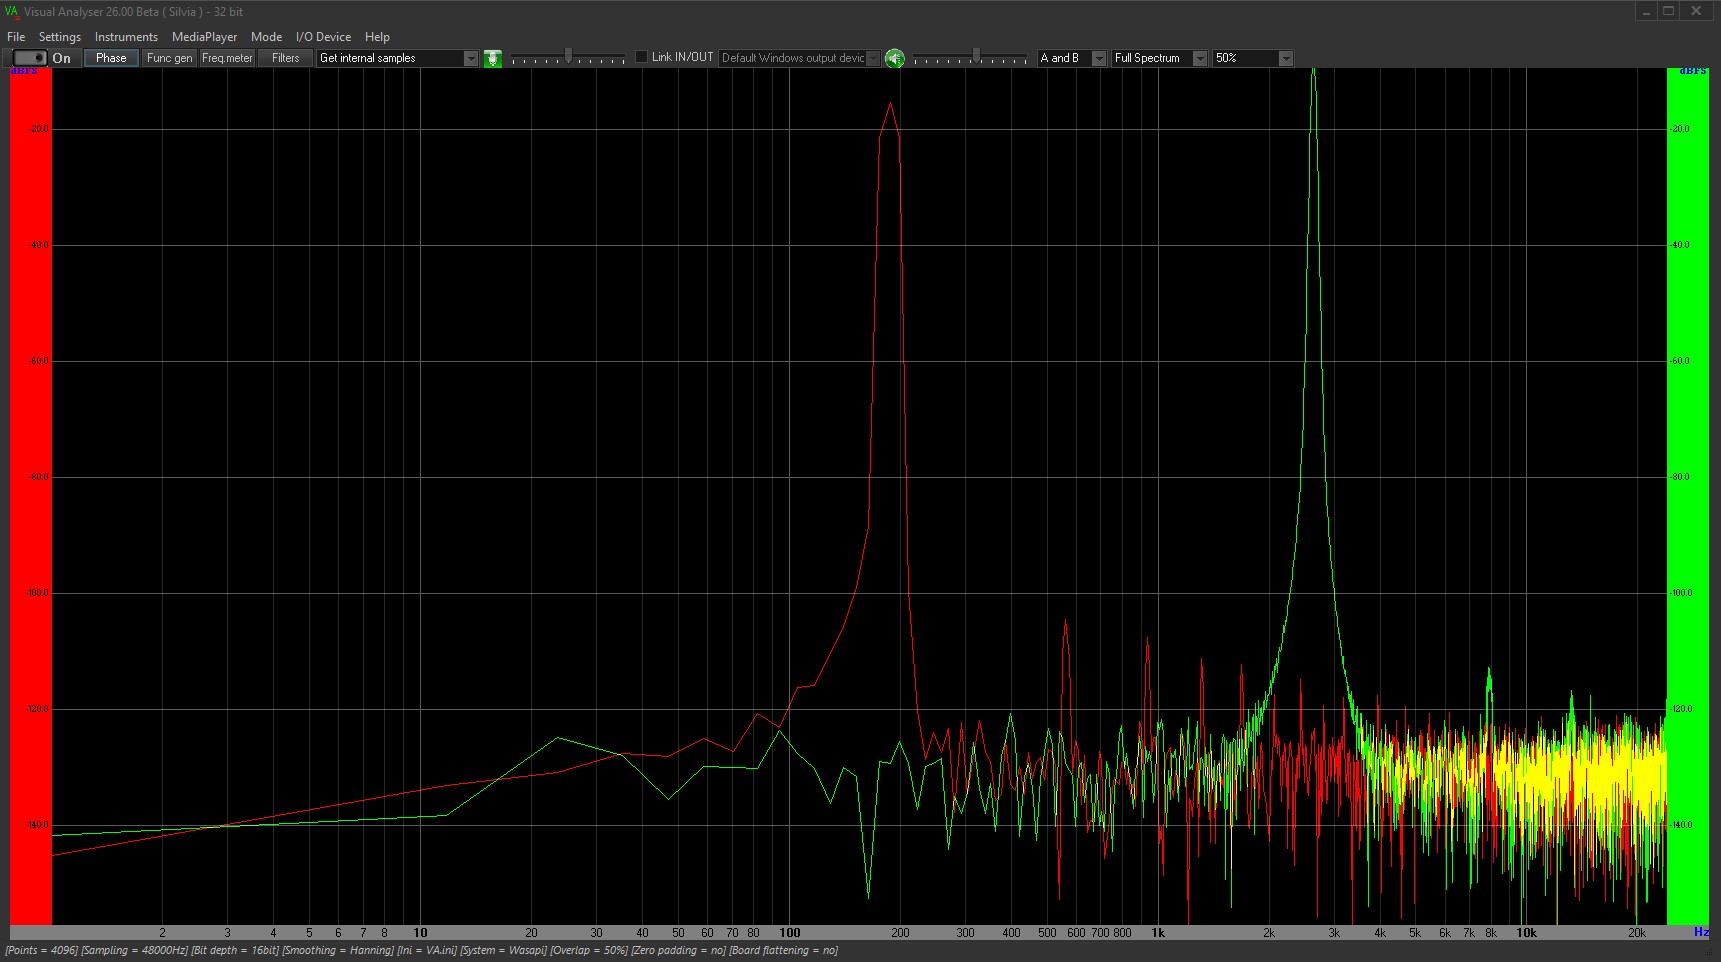
Conventional FFT spectrum
VA normally uses the fast Fourier transform to decompose a block of samples into uniformly spaced frequency components. Buffer length, sample rate and window determine the resolution, response time and leakage behaviour.
Custom Spectrum
When a uniformly spaced FFT grid is not ideal, VA can use a bank of Goertzel filters to evaluate a completely arbitrary list of frequencies. The components may even use decimal frequency values and can be selected around the needs of a specific measurement.
One analyser, two complementary approaches
Use FFT for a dense general-purpose view of the signal. Use Custom Spectrum when the exact frequencies are known in advance or when a compact application-specific display is preferable.
Explore Custom SpectrumWindows, averaging and overlap
Window functions control spectral leakage. Averaging stabilises noisy measurements, while FFT overlap lets VA process partially shared acquisition blocks. The available 50% and 75% overlap modes provide more frequent spectral updates and make better use of continuously acquired data, at the cost of additional processing.
3D and Waterfall representations
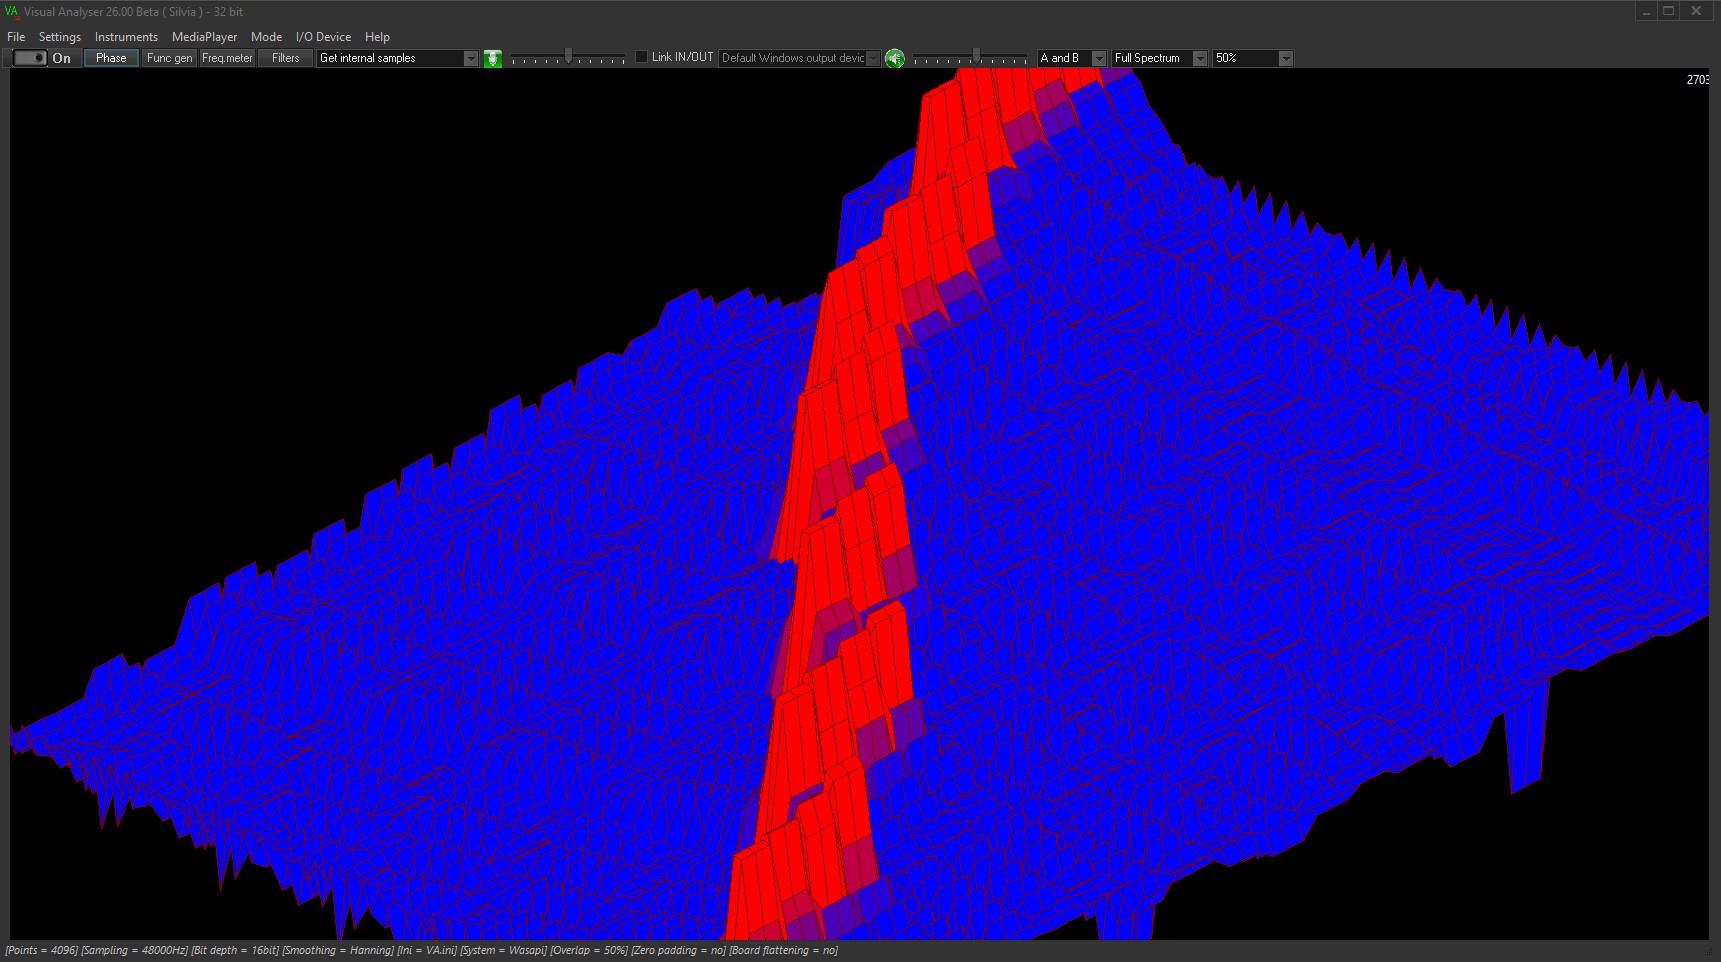
The 3D Custom Spectrum presents selected Goertzel components as a coloured evolving surface. Waterfall, instead, is a chronological stack of consecutive spectra and is particularly suited to decay, transient and time-evolution analysis.
- Linear and logarithmic axes
- Amplitude and decibel scales
- Selectable windows
- 0%, 50% and 75% FFT overlap
- Averaging and smoothing
- Arbitrary Goertzel frequencies
- Peak and harmonic readings
- 3D and Waterfall views
Waterfall: spectrum over time
The waterfall view stores successive FFT spectra and offsets them along a time axis. It shows how spectral components evolve, appear and disappear. It is different from Custom Spectrum, which selects arbitrary analysis frequencies through Goertzel filters, and from the coloured real-time 3D surface used to display Custom Spectrum results.