VA combines 15- and 31-band graphic equalisers with a twelve-filter-per-channel parametric bank. Adjust them manually or derive parametric proposals from acoustic ESS measurements to address room-response peaks or study a loudspeaker’s gated response.
Screenshots collected during development of the 26 series; some visible controls and version numbers may predate 26.44. Click images to open them at full resolution.
Choose the right signal route
The player equaliser processes files played by VA: use this route to listen with correction. The analyser equaliser in Settings / Filters processes the signal used for display and measurements. The two routes have independent settings; they do not automatically equalise other Windows applications.
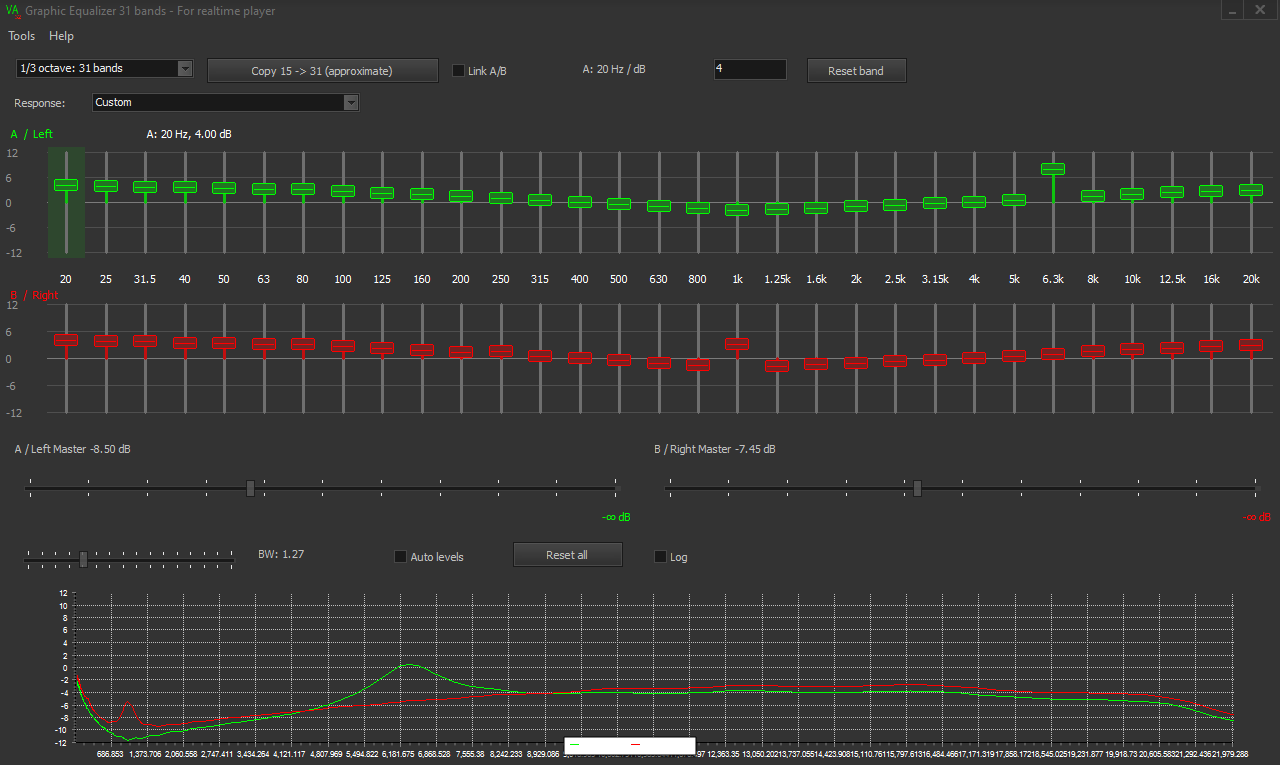
Graphic equaliser: 15 or 31 bands
The two configurations retain independent curves and presets. Channels A/B have separate filters and output levels; Link A/B links fader changes. Copying from 15 to 31 bands interpolates gains and is an approximation, not an identical transfer function.
Parametric EQ: frequency, gain and Q
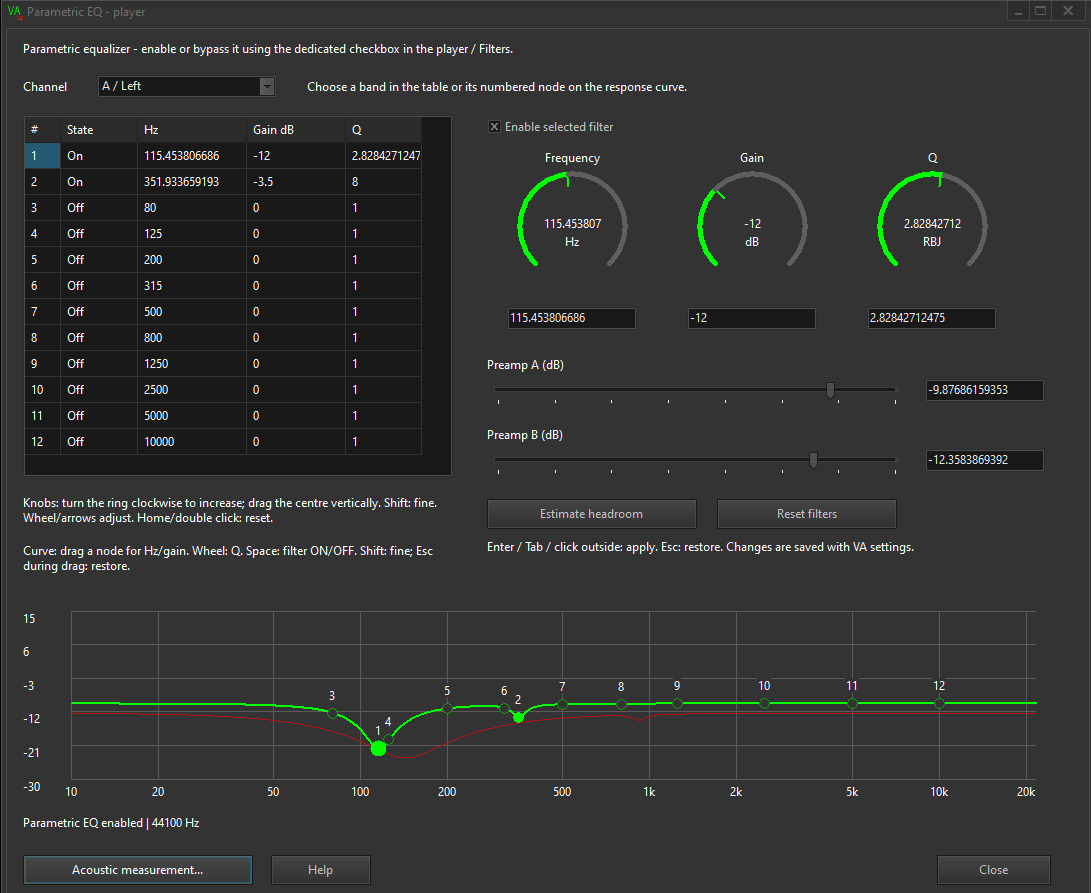
Each channel provides twelve independent peaking filters: frequency in Hz, gain from −24 to +12 dB and Q from 0.1 to 50. Higher Q narrows the correction. Use numeric fields, rotary controls or curve nodes; separate preamps provide attenuation for digital headroom. The headroom estimate helps lower levels but does not guarantee freedom from every transient peak.
Measurement-guided room equalisation
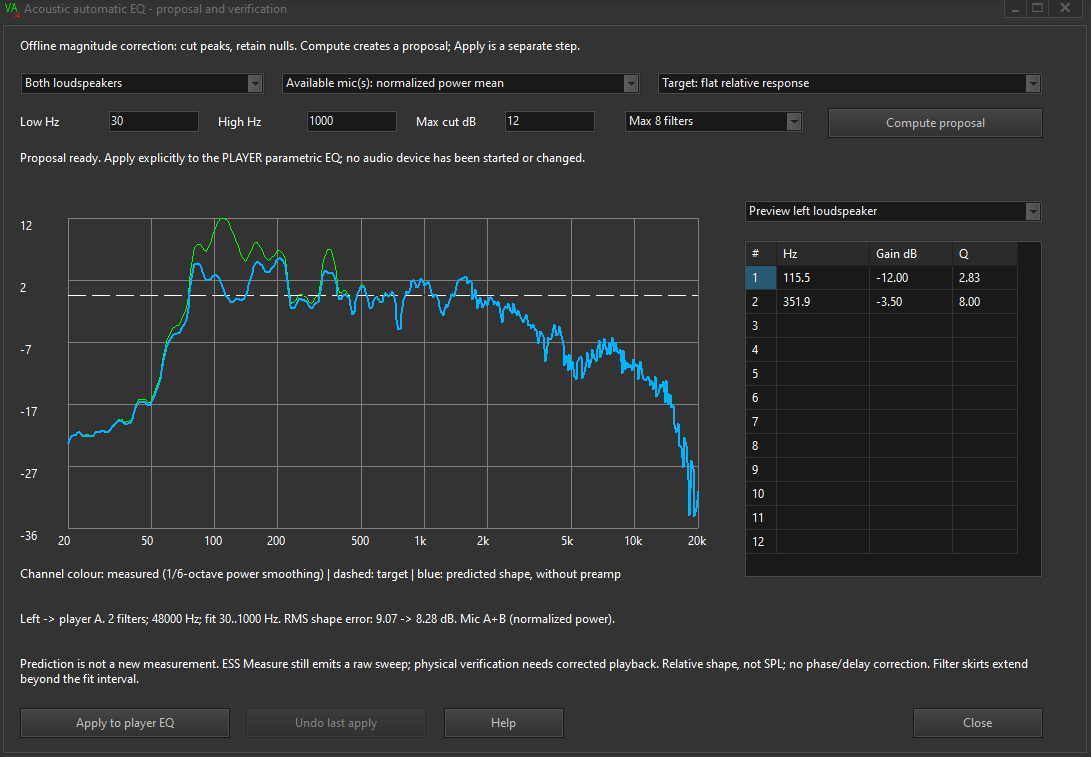
Auto EQ uses available acoustic responses for the left loudspeaker, right loudspeaker or both. Choose the microphone policy, frequency interval, target, maximum attenuation and maximum filter count. The optimiser proposes peak cuts and may use fewer filters than the selected maximum: it does not fill deep nulls with boosts.
- Measure one loudspeaker at a time using ESS and a physical microphone input; retain the original session.
- Compute a proposal within the useful band and inspect filters, target and predicted response.
- Apply to the player parametric bank and check that it is enabled on the intended channel. Applying replaces the selected channels’ filters.
- Perform a physical comparison using Verify with player parametric EQ, keeping geometry, levels and analysis windows consistent.
Loudspeaker proposals and correction verification
A gated loudspeaker proposal is separate from room Auto EQ. Choose a window suited to the direct response and a band consistent with the gate duration and measurement chain. Applying a proposal does not automatically cascade loudspeaker and room correction. Normal ESS measurement remains uncorrected: explicitly select Verify with player parametric EQ to measure the correction. Verification includes the player channel filters and preamp and should be saved separately from the raw measurement.
For individual controls, consult VA’s integrated help: GraphEq, ParametricEq, FreqResp, WavePlayer.