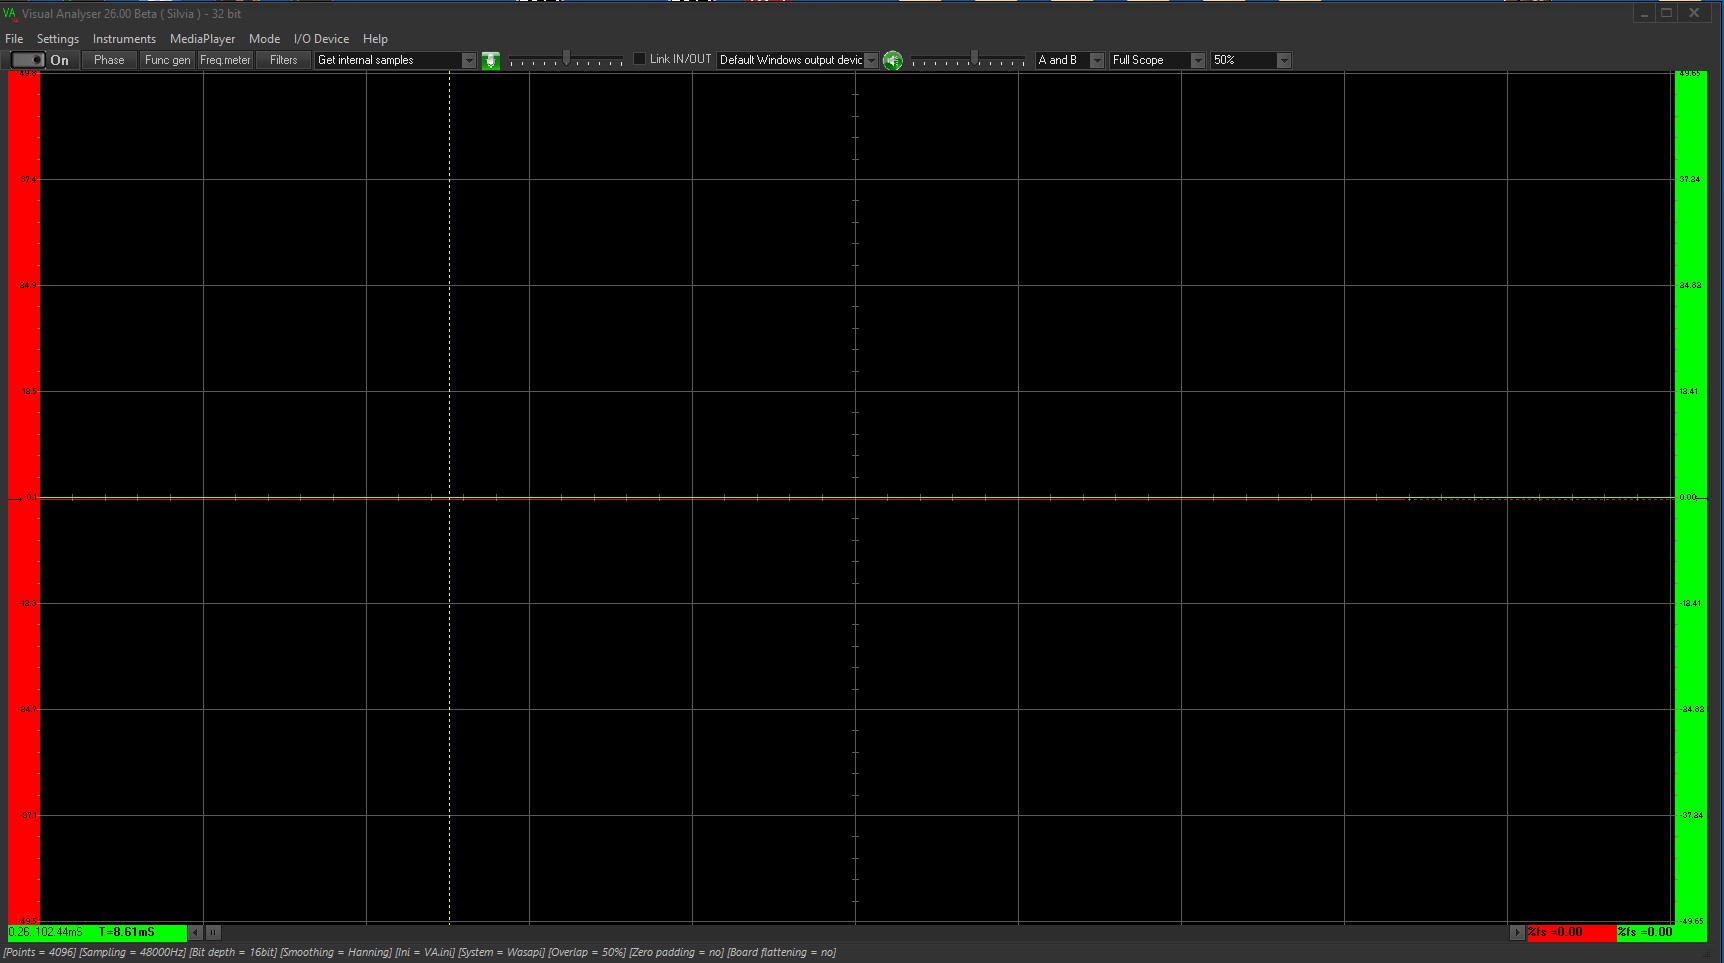
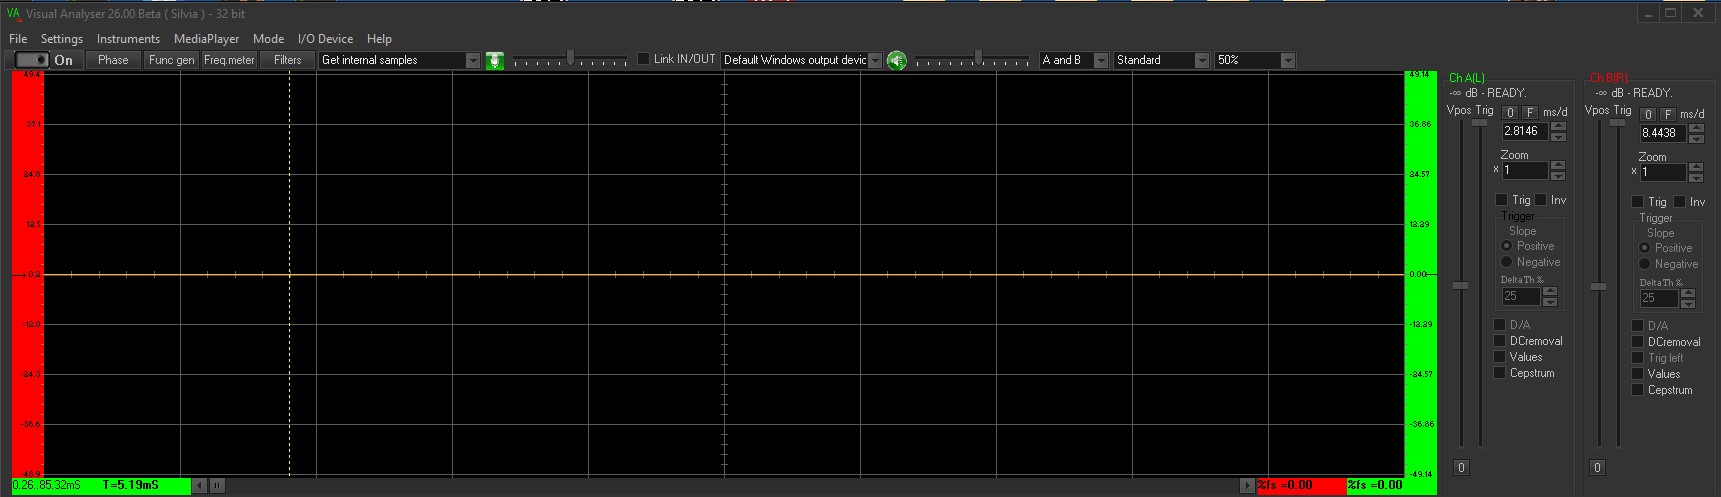
The oscilloscope is one of Visual Analyser’s two core instruments. It uses samples acquired by the audio interface to display the signal in the time domain, but it does much more than draw a trace: it automatically measures the main parameters, provides trigger and time-base controls, retains samples for later inspection and works together with the spectrum analyser, frequency meter, filters and recorder.
Measured quantities
For each channel VA can determine frequency, mean value, true RMS, peak, peak-to-peak value, crest factor and form factor. Numerical readings and the displayed waveform are derived from the same acquisition, keeping the two views consistent.
- Two simultaneously acquired channels
- Adjustable trigger level and slope
- Time base and buffer navigation
- Real-time automatic measurements
- XY mode and channel comparison
- Graphic and numeric export
Time base, zoom and acquisition buffer
The time-division control selects how much of the signal is visible. Since the samples are already stored in memory, the user can zoom, scroll through the acquisition and inspect an event after it has occurred. Horizontal navigation moves through the buffer, while vertical zoom changes the graphic resolution without changing the original samples.
Trigger and trace stability
The trigger synchronises the beginning of the display with a selected signal event. VA provides level, channel and slope selection, allowing periodic waveforms to remain stable on screen. With weak, noisy or distorted signals, choosing a less unstable crossing point—or inspecting a captured buffer—can produce more reliable results.
Waveform reconstruction
A sample sequence is not yet a continuous line. VA may show the acquired points or reconstruct the waveform between samples. Reconstruction becomes especially useful near the upper part of the available bandwidth, where only a few samples describe each period and a simple straight-line connection can be misleading.
Typical applications
Generators and circuits
Check amplitude, frequency, offset, symmetry and transients in periodic or pulsed signals.
Input/output comparison
Observe two circuit points simultaneously to estimate gain, delay and deformation.
Audio and acoustics
Inspect music, impulses, noise and the time-domain behaviour of audio chains.
Education
Demonstrate sampling, clipping, phase, RMS value and crest factor directly.
Related instruments
The spectrum analyser describes the same acquisition in the frequency domain; the frequency meter provides a dedicated fundamental-frequency reading; the recorder stores longer sessions; filters let the user observe processed signals in real time.
Read more in the Visual Analyser Handbook
This page is an operational introduction. Chapter 5 — Oscilloscope of the forthcoming book covers theory, controls, algorithms, examples and measurement notes in much greater depth.